

 Al-Riyadi
 Antonine
 Antranik
 Atlas Ferzol
 Beirut
 Central
 Chabeb El Batroun
 Homenetmen
 Hoops
 NSA
 Sagesse
 WASL Final 8
Stats
26 Sep – 4 Oct 2026 · Zouk Mikael
Share
cedarsmetrics.com/wasl26
WhatsApp (opens in a new tab) X (opens in a new tab) Facebook (opens in a new tab)Efficiency
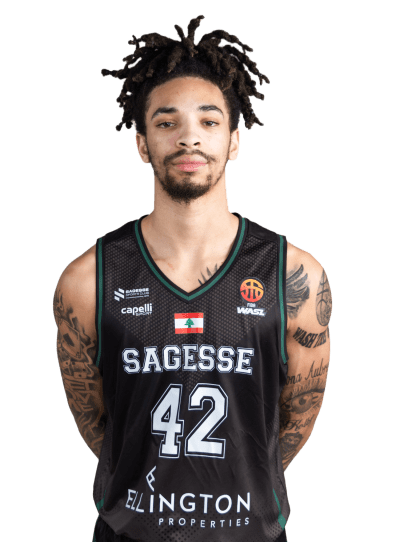
 SAG
Deshawndre Washington
31.6
EFF
5 GP
| # | Player | GP | PTS | REB | AST | EFF |
|---|---|---|---|---|---|---|
| 1 |
Deshawndre Washington
SAG
PTS 21.8 · REB 11.2 · AST 8.0
|
5 | 21.8 | 11.2 | 8.0 | 31.6 |
| 2 |
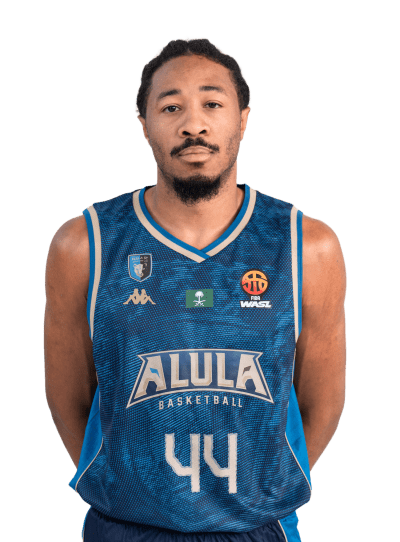 Elijah Stewart  ULA
PTS 27.2 · REB 4.8 · AST 4.0 |
5 | 27.2 | 4.8 | 4.0 | 27.6 |
| 3 |
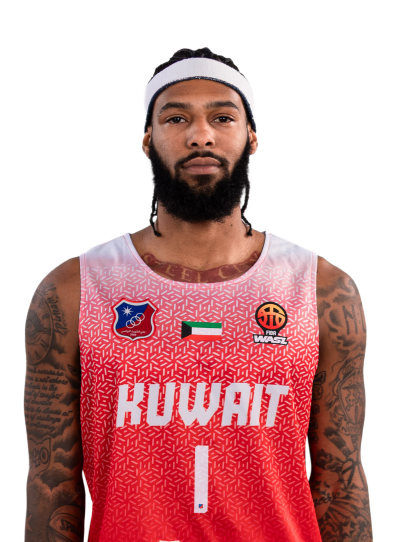 Devone Octavon Grant  KUW
PTS 25.8 · REB 5.2 · AST 8.2 |
5 | 25.8 | 5.2 | 8.2 | 27.4 |
| 4 |
 Cleanthony Robert Early  IRL
PTS 27.7 · REB 5.7 · AST 2.3 |
3 | 27.7 | 5.7 | 2.3 | 26.3 |
| 5 |
 Chinanu Onuaku
KUW
PTS 18.4 · REB 13.0 · AST 2.2 |
5 | 18.4 | 13.0 | 2.2 | 25.8 |
| 6 |
 Amorie Anthony Archibald  ITJ
PTS 24.0 · REB 3.7 · AST 6.7 |
3 | 24.0 | 3.7 | 6.7 | 25.7 |
| 7 |
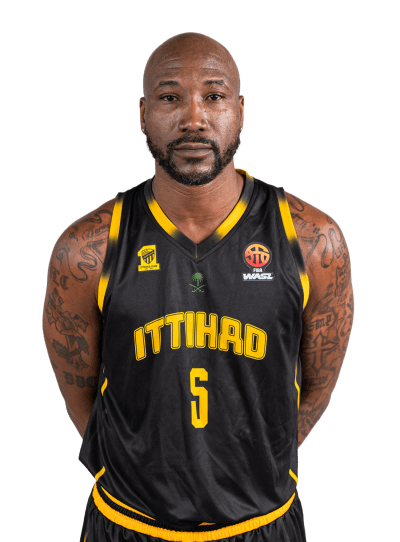 Devon Chism
ITJ
PTS 16.0 · REB 15.3 · AST 1.0 |
3 | 16.0 | 15.3 | 1.0 | 25.3 |
| 8 |
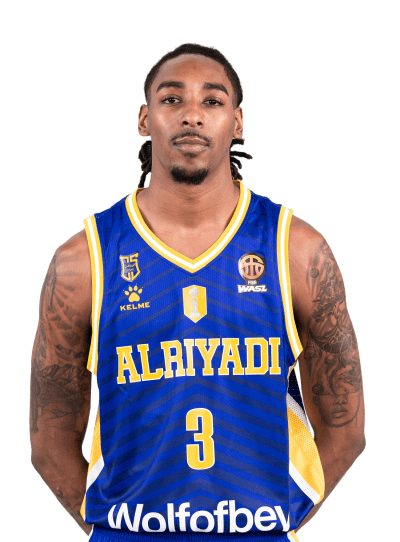 Donovan Kennedy Williams  RIY
PTS 27.4 · REB 8.6 · AST 0.8 |
5 | 27.4 | 8.6 | 0.8 | 22.6 |
| 9 |
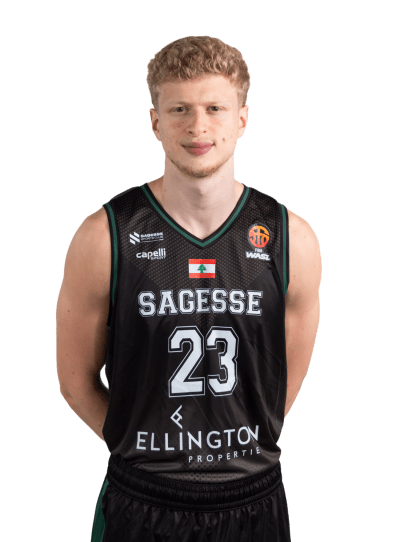 Youssef Khayat
SAG
PTS 19.8 · REB 6.3 · AST 1.5 |
4 | 19.8 | 6.3 | 1.5 | 22.5 |
| 10 |
 Darlinstone Miles Dubar
IRL
PTS 22.7 · REB 8.3 · AST 1.7 |
3 | 22.7 | 8.3 | 1.7 | 21.0 |
| 11 |
 Mitch Creek
ULA
PTS 17.8 · REB 9.0 · AST 2.8 |
5 | 17.8 | 9.0 | 2.8 | 20.8 |
| 12 |
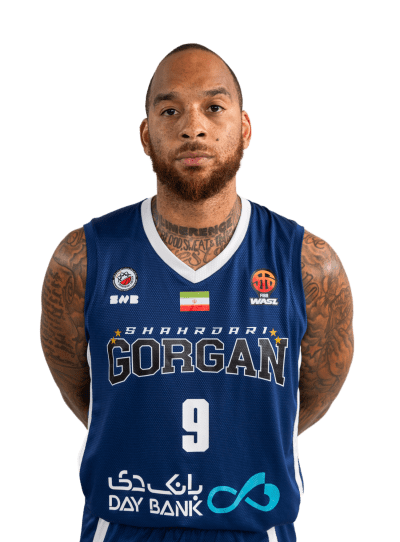 D'Angelo Harrison  GOR
PTS 20.0 · REB 5.7 · AST 3.3 |
3 | 20.0 | 5.7 | 3.3 | 20.7 |
| 13 |
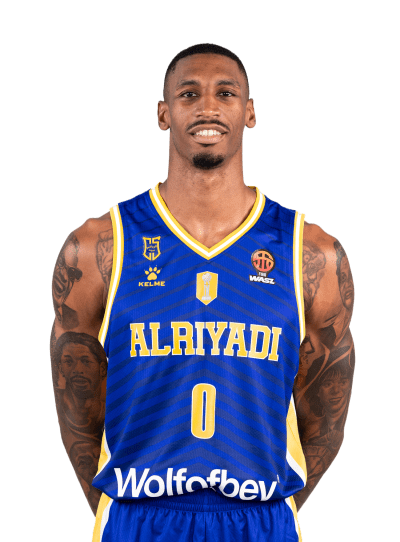 Nicholas Simon West
RIY
PTS 13.0 · REB 8.8 · AST 1.2 |
5 | 13.0 | 8.8 | 1.2 | 20.6 |
| 14 |
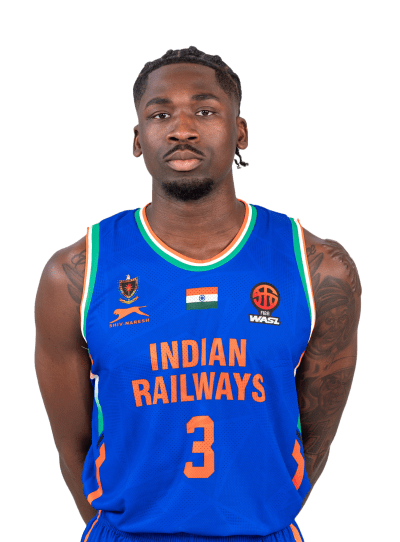 Tim Bryan Dalger
IRL
PTS 22.0 · REB 8.0 · AST 4.3 |
3 | 22.0 | 8.0 | 4.3 | 20.0 |
| 15 |
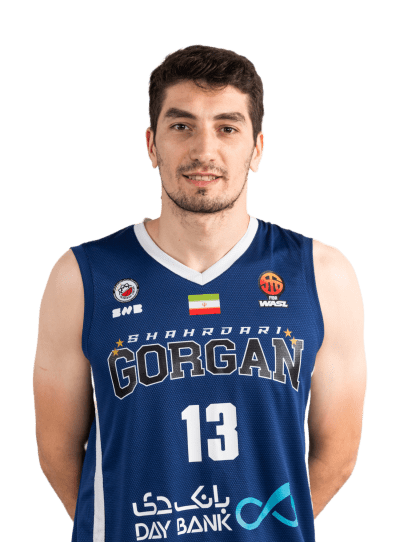 Sajjad Pazirofteh
GOR
PTS 11.7 · REB 9.3 · AST 2.3 |
3 | 11.7 | 9.3 | 2.3 | 19.7 |
| 16 |
 David Michineau
ULA
PTS 18.2 · REB 8.2 · AST 5.8 |
5 | 18.2 | 8.2 | 5.8 | 19.2 |
| 17 |
 Khalid Abdel Gabar
ITJ
PTS 13.3 · REB 4.0 · AST 8.0 |
3 | 13.3 | 4.0 | 8.0 | 19.0 |
| 18 |
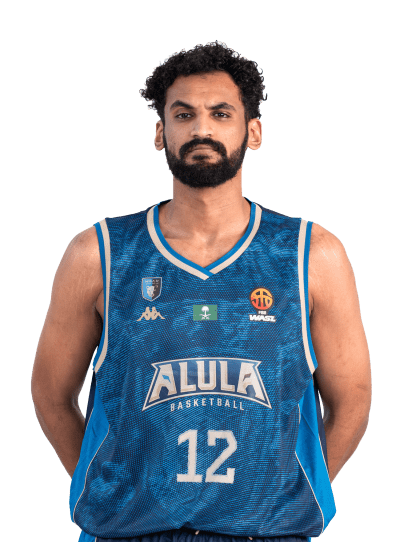 Mohammed Alsuwailem
ULA
PTS 14.0 · REB 11.2 · AST 0.8 |
5 | 14.0 | 11.2 | 0.8 | 18.0 |
| 19 |
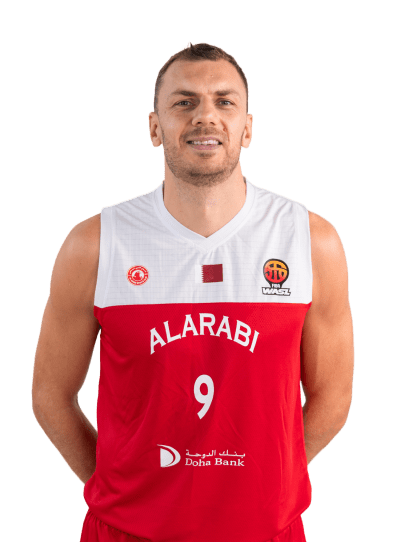 Elmedin Kikanovic  ARB
PTS 17.7 · REB 11.7 · AST 2.0 |
3 | 17.7 | 11.7 | 2.0 | 18.0 |
| 20 |
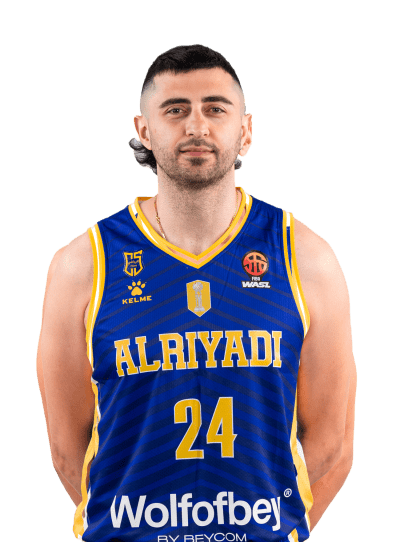 Hayk Gyokchyan
RIY
PTS 12.4 · REB 8.0 · AST 3.6 |
5 | 12.4 | 8.0 | 3.6 | 17.2 |
Per game, players with at least 3 games (half of the most games a team has played).
Teams
| Team | PPG | OPP | NRtg |
|---|---|---|---|
|
RIY
GP 5 · RPG 39.4 · APG 21 · TOV 10.8 · FG% 43.6 · 3P% 24.1 · ORtg 107.7 · DRtg 96 · Pace 80 · eFG% 48.2 · TS% 53.2 |
86.2 | 76.8 | +11.7 |
|
ULA
GP 5 · RPG 42.6 · APG 17.2 · TOV 11.2 · FG% 45 · 3P% 33.3 · ORtg 112.5 · DRtg 101.9 · Pace 80.9 · eFG% 50.7 · TS% 54.8 |
91 | 82.4 | +10.6 |
|
SAG
GP 5 · RPG 36 · APG 19 · TOV 7.6 · FG% 47.1 · 3P% 32.8 · ORtg 116.4 · DRtg 110.6 · Pace 76 · eFG% 52.7 · TS% 56.9 |
88.4 | 84 | +5.8 |
|
KUW
GP 5 · RPG 39.6 · APG 20 · TOV 13.8 · FG% 43.3 · 3P% 28.9 · ORtg 107.2 · DRtg 110.8 · Pace 83.2 · eFG% 49.4 · TS% 54 |
89.2 | 92.2 | -3.6 |
|
GOR
GP 3 · RPG 35.7 · APG 18.3 · TOV 8 · FG% 44.3 · 3P% 32.6 · ORtg 112.1 · DRtg 117.1 · Pace 79.1 · eFG% 51.4 · TS% 55.1 |
88.7 | 92.7 | -5.1 |
|
IRL
GP 3 · RPG 41.7 · APG 13.3 · TOV 18 · FG% 44.7 · 3P% 38.7 · ORtg 103.6 · DRtg 111.1 · Pace 88.5 · eFG% 53 · TS% 56.6 |
91.7 | 98.3 | -7.5 |
|
ITJ
GP 3 · RPG 35 · APG 20 · TOV 10.3 · FG% 39.7 · 3P% 29 · ORtg 103 · DRtg 113.8 · Pace 83.5 · eFG% 46.7 · TS% 50.9 |
86 | 95 | -10.8 |
|
ARB
GP 3 · RPG 36.7 · APG 15.3 · TOV 9.3 · FG% 40.7 · 3P% 26.7 · ORtg 96 · DRtg 111.7 · Pace 80.9 · eFG% 45.4 · TS% 47.9 |
77.7 | 90.3 | -15.7 |
Games with a box score for both teams. Possessions are estimated as FGA + 0.44 × FTA − OREB + TOV, averaged over both teams; ratings are points per 100 possessions, as on the league pages.