

 Al-Riyadi
 Antonine
 Antranik
 Atlas Ferzol
 Beirut
 Central
 Chabeb El Batroun
 Homenetmen
 Hoops
 NSA
 Sagesse
 WASL Final 8

- 0-3
- Record
- 0%
- Win %
- 86
- PPG
- 95
- Opp PPG
- -9
- Diff
- -10.8
- NRtg
- #4
- Position
| # | Player | Pos | Height | GP | PPG | RPG | APG | MPG |
|---|---|---|---|---|---|---|---|---|
| 0 |
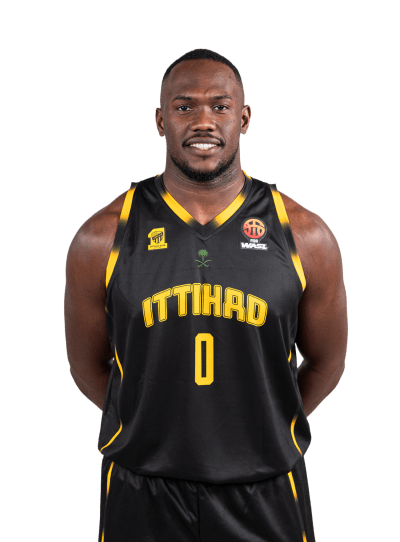 Osama Albargawi
#0 · SG · 1.88 m |
SG | 1.88 m | – | – | – | – | – |
| 2 |
 Thamer Mahmoud A Mohammed
#2 · F · 1.95 m |
F | 1.95 m | 3 | 1.7 | 0.3 | – | 6.9 |
| 3 |
 Amorie Anthony Archibald
#3 · F · 1.95 m |
F | 1.95 m | 3 | 24 | 3.7 | 6.7 | 31.1 |
| 5 |
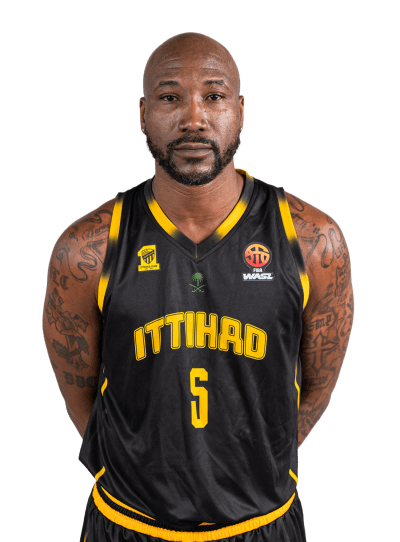 Devon Chism
#5 · PF · 2.03 m |
PF | 2.03 m | 3 | 16 | 15.3 | 1 | 29.3 |
| 6 |
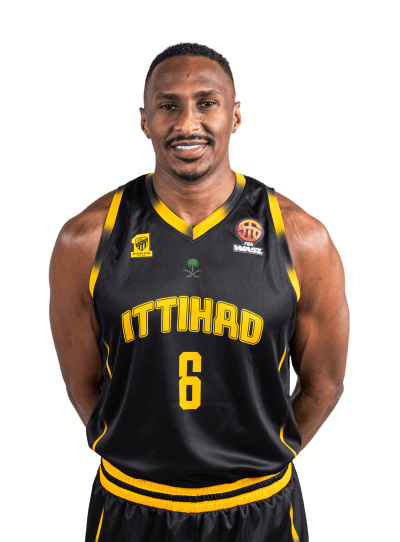 Mathna Almarwani
#6 · F · 1.92 m |
F | 1.92 m | 3 | 8.7 | 3 | 1.3 | 30.9 |
| 10 |
 Nasser Alabsi
#10 · SG · 1.88 m |
SG | 1.88 m | 3 | 1.3 | 1.3 | 0.3 | 10.9 |
| 12 |
 khalid alabsi
#12 · C · 1.99 m |
C | 1.99 m | – | – | – | – | – |
| 13 |
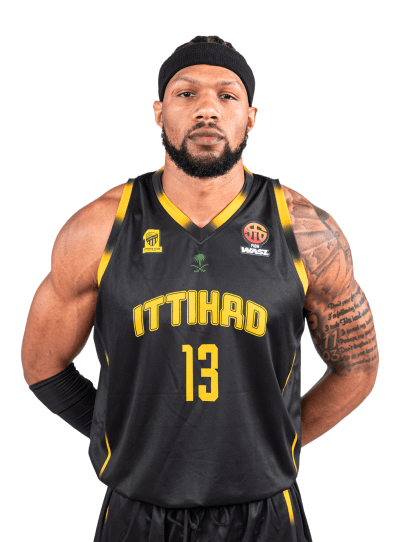 Marvin Clark
#13 · F · 2.01 m |
F | 2.01 m | 3 | 15 | 4.7 | 2.7 | 33.7 |
| 21 |
 Khalid Abdel Gabar
#21 · G · 1.83 m |
G | 1.83 m | 3 | 13.3 | 4 | 8 | 34.8 |
| 24 |
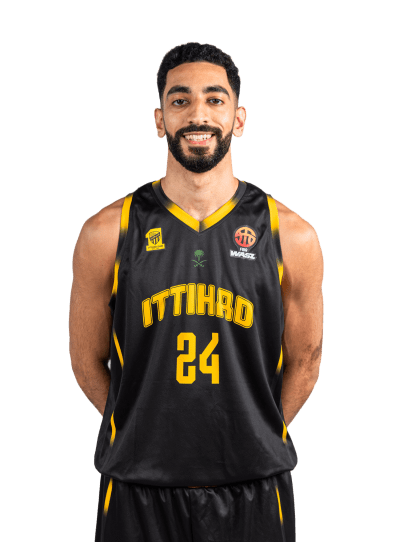 Manaf Alsalem
#24 · SG · 1.94 m |
SG | 1.94 m | 3 | – | 1 | – | 4.8 |
| 32 |
 Mohammed Kadi
#32 · F · 1.92 m |
F | 1.92 m | 1 | – | 1 | – | 2.2 |
| 99 |
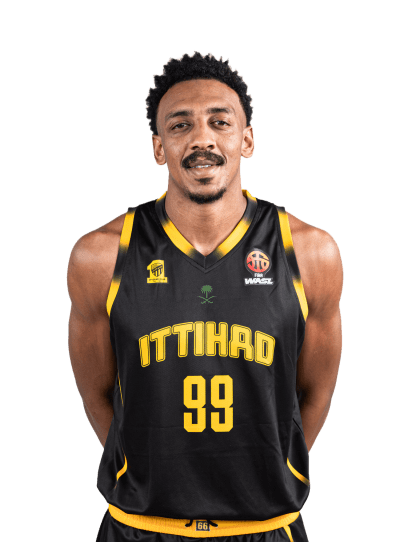 Musab Tariq M Kadi
#99 · PF · 1.96 m |
PF | 1.96 m | 3 | 6 | 1.3 | – | 16.9 |
Photos: courtesy of FIBA WASL Final 8 2026
Team leaders
Scoring trend
Shooting splits
Team averages 3 games
Scoring
- Points
- 86
- Opp points
- 95
- Paint points
- 25
- Fast break
- 3
- 2nd chance
- 2
- Off turnovers
- 11
- Bench points
- 22.7
Shooting
- FG
- 39.7% · 74.7 att./g
- 3PT
- 29% · 35.7 att./g
- 2PT
- 49.6% · 39.0 att./g
- FT
- 73.1% · 22.3 att./g
- Opp FG%
- 49.2%
- Opp 3P%
- 35.5%
Rebounding
- Total RPG
- 35
- Offensive
- 12
- Defensive
- 23
- Opp RPG
- 38.7
Other
- Assists
- 20
- Turnovers
- 10.3
- Steals
- 8
- Blocks
- 1.7
- Fouls
- 21.3
- Biggest lead
- –
- Opp APG
- 18.7
- Opp TOV
- 14.3
Points breakdown per game
Team vs opponents tournament average = 100
| Player | GP | PPG | Total | FGM/A | 3PM/A | FTM/A | High | Best game |
|---|---|---|---|---|---|---|---|---|
| 1
A. Archibald#3FGP 3 · FGM/A 24-46 (52.2%) · 3PM/A 11-24 (45.8%) · FTM/A 13-14 (92.9%) · High 34 · Best game 26 Sep v KUW | 24 | 72 | ||||||
| 2
D. Chism#5PFGP 3 · FGM/A 16-35 (45.7%) · 3PM/A 1-4 (25%) · FTM/A 15-19 (78.9%) · High 21 · Best game 30 Sep v RIY | 16 | 48 | ||||||
| 3
M. Clark#13FGP 3 · FGM/A 14-40 (35%) · 3PM/A 7-24 (29.2%) · FTM/A 10-14 (71.4%) · High 23 · Best game 26 Sep v KUW | 15 | 45 | ||||||
| 4
K. Abdel Gabar#21GGP 3 · FGM/A 14-35 (40%) · 3PM/A 8-25 (32%) · FTM/A 4-5 (80%) · High 22 · Best game 28 Sep v IRL | 13.3 | 40 | ||||||
| 5
M. Almarwani#6FGP 3 · FGM/A 9-29 (31%) · 3PM/A 2-12 (16.7%) · FTM/A 6-10 (60%) · High 10 · Best game 28 Sep v IRL | 8.7 | 26 | ||||||
| 6
M. Kadi#99PFGP 3 · FGM/A 8-19 (42.1%) · 3PM/A 2-11 (18.2%) · FTM/A 0-4 (0%) · High 9 · Best game 26 Sep v KUW | 6 | 18 | ||||||
| 7
T. Mohammed#2FGP 3 · FGM/A 2-6 (33.3%) · 3PM/A 0-0 (0%) · FTM/A 1-1 (100%) · High 5 · Best game 30 Sep v RIY | 1.7 | 5 | ||||||
| 8
N. Alabsi#10SGGP 3 · FGM/A 2-10 (20%) · 3PM/A 0-6 (0%) · FTM/A 0-0 (0%) · High 2 · Best game 28 Sep v IRL | 1.3 | 4 | ||||||
| 9
M. Alsalem#24SGGP 3 · FGM/A 0-4 (0%) · 3PM/A 0-1 (0%) · FTM/A 0-0 (0%) · High 0 · Best game 26 Sep v KUW | 0 | 0 | ||||||
| 10
M. Kadi#32FGP 1 · FGM/A 0-0 (0%) · 3PM/A 0-0 (0%) · FTM/A 0-0 (0%) · High 0 · Best game 28 Sep v IRL | 0 | 0 |
| Player | GP | FG% | FGM/A | 3P% | 3PM/A | 2P% | 2PM/A | FT% | FTM/A |
|---|---|---|---|---|---|---|---|---|---|
| 1
A. Archibald#3FGP 3 · FGM/A 24-46 · 3PM/A 11-24 · 2P% 59.1 · 2PM/A 13-22 · FTM/A 13-14 | 52.2 | 45.8 | 92.9 | ||||||
| 2
D. Chism#5PFGP 3 · FGM/A 16-35 · 3PM/A 1-4 · 2P% 48.4 · 2PM/A 15-31 · FTM/A 15-19 | 45.7 | 25 | 78.9 | ||||||
| 3
M. Kadi#99PFGP 3 · FGM/A 8-19 · 3PM/A 2-11 · 2P% 75 · 2PM/A 6-8 · FTM/A 0-4 | 42.1 | 18.2 | 0 | ||||||
| 4
K. Abdel Gabar#21GGP 3 · FGM/A 14-35 · 3PM/A 8-25 · 2P% 60 · 2PM/A 6-10 · FTM/A 4-5 | 40 | 32 | 80 | ||||||
| 5
M. Clark#13FGP 3 · FGM/A 14-40 · 3PM/A 7-24 · 2P% 43.8 · 2PM/A 7-16 · FTM/A 10-14 | 35 | 29.2 | 71.4 | ||||||
| 6
T. Mohammed#2FGP 3 · FGM/A 2-6 · 3PM/A 0-0 · 2P% 33.3 · 2PM/A 2-6 · FTM/A 1-1 | 33.3 | 0 | 100 | ||||||
| 7
M. Almarwani#6FGP 3 · FGM/A 9-29 · 3PM/A 2-12 · 2P% 41.2 · 2PM/A 7-17 · FTM/A 6-10 | 31 | 16.7 | 60 | ||||||
| 8
N. Alabsi#10SGGP 3 · FGM/A 2-10 · 3PM/A 0-6 · 2P% 50 · 2PM/A 2-4 · FTM/A 0-0 | 20 | 0 | 0 | ||||||
| 9
M. Alsalem#24SGGP 3 · FGM/A 0-4 · 3PM/A 0-1 · 2P% 0 · 2PM/A 0-3 · FTM/A 0-0 | 0 | 0 | 0 | ||||||
| 10
M. Kadi#32FGP 1 · FGM/A 0-0 · 3PM/A 0-0 · 2P% 0 · 2PM/A 0-0 · FTM/A 0-0 | 0 | 0 | 0 |
| Player | GP | RPG | Total | ORPG | DRPG | High | Best game |
|---|---|---|---|---|---|---|---|
| 1
D. Chism#5PFGP 3 · ORPG 6.3 · DRPG 9 · High 19 · Best game 28 Sep v IRL | 15.3 | 46 | |||||
| 2
M. Clark#13FGP 3 · ORPG 1 · DRPG 3.7 · High 7 · Best game 30 Sep v RIY | 4.7 | 14 | |||||
| 3
K. Abdel Gabar#21GGP 3 · ORPG 1 · DRPG 3 · High 6 · Best game 26 Sep v KUW | 4 | 12 | |||||
| 4
A. Archibald#3FGP 3 · ORPG 1 · DRPG 2.7 · High 5 · Best game 30 Sep v RIY | 3.7 | 11 | |||||
| 5
M. Almarwani#6FGP 3 · ORPG 1 · DRPG 2 · High 4 · Best game 30 Sep v RIY | 3 | 9 | |||||
| 6
M. Kadi#99PFGP 3 · ORPG 0 · DRPG 1.3 · High 2 · Best game 26 Sep v KUW | 1.3 | 4 | |||||
| 7
N. Alabsi#10SGGP 3 · ORPG 1 · DRPG 0.3 · High 2 · Best game 28 Sep v IRL | 1.3 | 4 | |||||
| 8
M. Alsalem#24SGGP 3 · ORPG 0.3 · DRPG 0.7 · High 2 · Best game 28 Sep v IRL | 1 | 3 | |||||
| 9
M. Kadi#32FGP 1 · ORPG 0 · DRPG 1 · High 1 · Best game 28 Sep v IRL | 1 | 1 | |||||
| 10
T. Mohammed#2FGP 3 · ORPG 0.3 · DRPG 0 · High 1 · Best game 30 Sep v RIY | 0.3 | 1 |
| Player | GP | APG | Total AST | TOPG | AST/TO | High AST | Best game |
|---|---|---|---|---|---|---|---|
| 1
K. Abdel Gabar#21GGP 3 · Total AST 24 · TOPG 1.3 · High AST 8 · Best game 26 Sep v KUW | 8 | 6.2 | |||||
| 2
A. Archibald#3FGP 3 · Total AST 20 · TOPG 2.7 · High AST 9 · Best game 26 Sep v KUW | 6.7 | 2.5 | |||||
| 3
M. Clark#13FGP 3 · Total AST 8 · TOPG 2.3 · High AST 4 · Best game 28 Sep v IRL | 2.7 | 1.2 | |||||
| 4
M. Almarwani#6FGP 3 · Total AST 4 · TOPG 1.7 · High AST 2 · Best game 26 Sep v KUW | 1.3 | 0.8 | |||||
| 5
D. Chism#5PFGP 3 · Total AST 3 · TOPG 1 · High AST 2 · Best game 30 Sep v RIY | 1 | 1 | |||||
| 6
N. Alabsi#10SGGP 3 · Total AST 1 · TOPG 0.3 · High AST 1 · Best game 28 Sep v IRL | 0.3 | 1 | |||||
| 7
M. Kadi#99PFGP 3 · Total AST 0 · TOPG 0.3 · High AST 0 · Best game 26 Sep v KUW | 0 | 0 | |||||
| 8
T. Mohammed#2FGP 3 · Total AST 0 · TOPG 0.7 · High AST 0 · Best game 26 Sep v KUW | 0 | 0 | |||||
| 9
M. Alsalem#24SGGP 3 · Total AST 0 · TOPG 0 · High AST 0 · Best game 26 Sep v KUW | 0 | 0.0 | |||||
| 10
M. Kadi#32FGP 1 · Total AST 0 · TOPG 0 · High AST 0 · Best game 28 Sep v IRL | 0 | 0.0 |
| Player | GP | SPG | Total STL | High STL | BPG | Total BLK | High BLK | FPG |
|---|---|---|---|---|---|---|---|---|
| 1
K. Abdel Gabar#21GGP 3 · Total STL 6 · High STL 2 · Total BLK 1 · High BLK 1 · FPG 2.3 | 2 | 0.3 | ||||||
| 2
A. Archibald#3FGP 3 · Total STL 5 · High STL 2 · Total BLK 0 · High BLK 0 · FPG 1.7 | 1.7 | 0 | ||||||
| 3
D. Chism#5PFGP 3 · Total STL 3 · High STL 2 · Total BLK 2 · High BLK 1 · FPG 3.3 | 1 | 0.7 | ||||||
| 4
M. Clark#13FGP 3 · Total STL 4 · High STL 2 · Total BLK 0 · High BLK 0 · FPG 3.7 | 1.3 | 0 | ||||||
| 5
M. Almarwani#6FGP 3 · Total STL 3 · High STL 2 · Total BLK 0 · High BLK 0 · FPG 2.7 | 1 | 0 | ||||||
| 6
T. Mohammed#2FGP 3 · Total STL 2 · High STL 2 · Total BLK 0 · High BLK 0 · FPG 0.3 | 0.7 | 0 | ||||||
| 7
M. Kadi#99PFGP 3 · Total STL 0 · High STL 0 · Total BLK 1 · High BLK 1 · FPG 2.7 | 0 | 0.3 | ||||||
| 8
N. Alabsi#10SGGP 3 · Total STL 1 · High STL 1 · Total BLK 0 · High BLK 0 · FPG 3.3 | 0.3 | 0 | ||||||
| 9
M. Alsalem#24SGGP 3 · Total STL 0 · High STL 0 · Total BLK 1 · High BLK 1 · FPG 1 | 0 | 0.3 | ||||||
| 10
M. Kadi#32FGP 1 · Total STL 0 · High STL 0 · Total BLK 0 · High BLK 0 · FPG 1 | 0 | 0 |
Complete player stats
| Player | GP | GS | MPG | PPG | RPG | APG | SPG | BPG | TOV | FG% | 3P% | FT% | EFF |
|---|---|---|---|---|---|---|---|---|---|---|---|---|---|
| 1
A. Archibald#3FGP 3 · GS 2 · MPG 31.1 · SPG 1.7 · BPG 0 · TOV 2.7 · FG% 52.2 · 3P% 45.8 · FT% 92.9 · EFF 25.7 |
3 | 2 | 31.1 | 24 | 3.7 | 6.7 | 1.7 | 0 | 2.7 | 52.2 | 45.8 | 92.9 | |
| 2
D. Chism#5PFGP 3 · GS 1 · MPG 29.3 · SPG 1 · BPG 0.7 · TOV 1 · FG% 45.7 · 3P% 25 · FT% 78.9 · EFF 25.3 |
3 | 1 | 29.3 | 16 | 15.3 | 1 | 1 | 0.7 | 1 | 45.7 | 25 | 78.9 | |
| 3
M. Clark#13FGP 3 · GS 3 · MPG 33.7 · SPG 1.3 · BPG 0 · TOV 2.3 · FG% 35 · 3P% 29.2 · FT% 71.4 · EFF 11.3 |
3 | 3 | 33.7 | 15 | 4.7 | 2.7 | 1.3 | 0 | 2.3 | 35 | 29.2 | 71.4 | |
| 4
K. Abdel Gabar#21GGP 3 · GS 3 · MPG 34.8 · SPG 2 · BPG 0.3 · TOV 1.3 · FG% 40 · 3P% 32 · FT% 80 · EFF 19 |
3 | 3 | 34.8 | 13.3 | 4 | 8 | 2 | 0.3 | 1.3 | 40 | 32 | 80 | |
| 5
M. Almarwani#6FGP 3 · GS 3 · MPG 30.9 · SPG 1 · BPG 0 · TOV 1.7 · FG% 31 · 3P% 16.7 · FT% 60 · EFF 4.3 |
3 | 3 | 30.9 | 8.7 | 3 | 1.3 | 1 | 0 | 1.7 | 31 | 16.7 | 60 | |
| 6
M. Kadi#99PFGP 3 · GS 0 · MPG 16.9 · SPG 0 · BPG 0.3 · TOV 0.3 · FG% 42.1 · 3P% 18.2 · FT% 0 · EFF 2.3 |
3 | 0 | 16.9 | 6 | 1.3 | 0 | 0 | 0.3 | 0.3 | 42.1 | 18.2 | 0 | |
| 7
T. Mohammed#2FGP 3 · GS 1 · MPG 6.9 · SPG 0.7 · BPG 0 · TOV 0.7 · FG% 33.3 · 3P% 0 · FT% 100 · EFF 0.7 |
3 | 1 | 6.9 | 1.7 | 0.3 | 0 | 0.7 | 0 | 0.7 | 33.3 | 0 | 100 | |
| 8
N. Alabsi#10SGGP 3 · GS 1 · MPG 10.9 · SPG 0.3 · BPG 0 · TOV 0.3 · FG% 20 · 3P% 0 · FT% 0 · EFF 0.3 |
3 | 1 | 10.9 | 1.3 | 1.3 | 0.3 | 0.3 | 0 | 0.3 | 20 | 0 | 0 | |
| 9
M. Alsalem#24SGGP 3 · GS 0 · MPG 4.8 · SPG 0 · BPG 0.3 · TOV 0 · FG% 0 · 3P% 0 · FT% 0 · EFF 0 |
3 | 0 | 4.8 | 0 | 1 | 0 | 0 | 0.3 | 0 | 0 | 0 | 0 | |
| 10
M. Kadi#32FGP 1 · GS 1 · MPG 2.2 · SPG 0 · BPG 0 · TOV 0 · FG% 0 · 3P% 0 · FT% 0 · EFF 1 |
1 | 1 | 2.2 | 0 | 1 | 0 | 0 | 0 | 0 | 0 | 0 | 0 |
| Date | Opponent | Result | Score | FG% | 3P% | REB | AST | STL | BLK | TOV | ||
|---|---|---|---|---|---|---|---|---|---|---|---|---|
| 30 Sep | @ |  Al Riyadi Beirut 30 Sep · @ · Box score
FG% 38.6 · 3P% 21.4 · REB 35 · AST 17 · STL 8 · BLK 2 · TOV 10 |
L 76-87 | Box score | ||||||||
| 28 Sep | @ |  Indian Railways 28 Sep · @ · Box score
FG% 36.6 · 3P% 26.1 · REB 34 · AST 23 · STL 11 · BLK 1 · TOV 10 |
L 85-93 | Box score | ||||||||
| 26 Sep | v |  Al Kuwait SC 26 Sep · v · Box score
FG% 44.4 · 3P% 39.4 · REB 36 · AST 20 · STL 5 · BLK 2 · TOV 11 |
L 97-105 | Box score |
Team strength vs tournament average higher = better · tournament = 100
Team vs tournament
| Stat | ITJ | tournament | +/- |
|---|---|---|---|
| PPG | 86 | 87.7 | -1.7 |
| RPG | 35 | 38.6 | -3.6 |
| APG | 20 | 18.3 | +1.7 |
| SPG | 8 | 6.6 | +1.4 |
| BPG | 1.7 | 2 | -0.3 |
| FG% | 39.7 | 43.9 | -4.2 |
| 3P% | 29 | 30.5 | -1.5 |
| FT% | 73.1 | 74.2 | -1.1 |
Defense: opponent averages allowed
| PPG | FG% | 3P% | |||||
|---|---|---|---|---|---|---|---|
| ITJRPG 35 · APG 20 · FT% 73.1 · TOV 10.3 | 86 | 35 | 20 | 39.7 | 29 | 73.1 | 10.3 |
| OpponentsRPG 38.7 · APG 18.7 · FT% 79.5 · TOV 14.3 | 95 | 38.7 | 18.7 | 49.2 | 35.5 | 79.5 | 14.3 |
Ratings · rank among the 8 teams of the tournament
ORtg
103
#7
DRtg
113.8
#7
NRtg
-10.8
#7
Pace
83.5
#2
Four factors · rank among the 8 teams of the tournament
eFG%
46.7%
#7
TOV%
10.9%
#4
ORB%
28.1%
#6
FT rate
0.3
#3
Opponent four factors · rank among the 8 teams of the tournament
OPP eFG%
56%
#8
OPP TOV%
15.6%
#1
OPP ORB%
25.8%
#2
OPP FT rate
0.39
#7
Shooting, rebounding & ball care · rank among the 8 teams of the tournament
TS%
50.9%
#7
PPS
1.15
#7
3PA rate
47.8%
#1
DRB%
74.2%
#2
TRB%
47.5%
#7
AST/TO
1.94
#4
Splits
| GP | W–L | PPG | OPP | Margin | |
|---|---|---|---|---|---|
| HomeGP 1 | 1 | 0–1 | 97 | 105 | -8 |
| AwayGP 2 | 2 | 0–2 | 80.5 | 90 | -9.5 |
| LossesGP 3 | 3 | 0–3 | 86 | 95 | -9 |
Clutch
Close games won
0%
0–2 · 2 of 3
Points for
1.0
per close game · 2 total
Against
4.0
per close game · 8 total
Net
-3.0
per close game
Last 5 minutes of the 4th quarter or overtime with the score within 5, from the play-by-play of 3 games.
Streaks & highs
Current
L3
Longest W
0
Longest L
3
- Most points 97–105 vs KUW · Sep 26
- Fewest points 76–87 @ RIY · Sep 30
- Heaviest loss 76–87 @ RIY · Sep 30
Possessions are estimated from each game's box score, averaged over both teams. FT rate is free throws attempted per field goal attempt.
Advanced
Scoring by quarter
| Q1 | Q2 | Q3 | Q4 | |
|---|---|---|---|---|
| For | 24.0 | 22.3 | 21.0 | 18.7 |
| Against | 23.3 | 24.0 | 27.0 | 20.7 |
- Biggest lead
- 16
- Largest deficit
- 14
Shooting · Profile
- 2P%
- 49.6%
- 3P%
- 29.0%
- FT%
- 73.1%
- Pts from 2s
- 45.0%
- Pts from 3s
- 36.0%
- Pts from FTs
- 19.0%
- Paint pts
- 25.0
- 2nd-chance pts
- 2.0
- Fast-break pts
- 3.0
- Pts off TO
- 11.0
- Bench pts
- 22.7
- AST rate
- 67.4%
- AST/TO
- 1.94
- BLK
- 1.7
- STL
- 8.0
Most-used lineups
| Lineup | MIN | +/- |
|---|---|---|
| 23.7 | +3 | |
| 9.2 | -2 | |
| 6.7 | 0 | |
| 6.3 | +1 | |
| 4.7 | -1 |
Left out of the play-by-play figures (needs play-by-play): Mon 28 Sep v IRL.
By game
Scouting report
Every line compares this team with the tournament average and ranks it among the 8 teams.
Games with box scores: 3 (2 with play-by-play) · Record 0-3 · Net rating -10.8
Style
- Three-point heavy 47.8% · #1
- Deep bench 26.4% · #1
Strengths
-
Forces turnovers
Turnovers forced
15.6%
avg 11.9% · 1 of 8
-
Moves the ball
Assist rate
67.4%
avg 57.8% · 2 of 8
-
Ends possessions on the glass
Defensive rebounding
74.2%
avg 71.1% · 2 of 8
Weaknesses
-
Allows easy shots
Opponents' eFG%
56.0%
avg 50.5% · 8 of 8
-
Opponents hit their threes
Opponents' 3P%
35.5%
avg 31.1% · 8 of 8
-
Fouls a lot
Opponents' free-throw rate
0.39
avg 0.30 · 7 of 8
-
Shoots poorly
Effective FG%
46.7%
avg 49.7% · 7 of 8
-
Leaks points
Defensive rating
113.8
avg 109.1 · 7 of 8
Identity
- Pace
- 83.5
- avg 81.5 · 2 of 8
- Offensive rating
- 103.0
- avg 107.3 · 7 of 8
- Defensive rating
- 113.8
- avg 109.1 · 7 of 8
- Three-point rate
- 47.8%
- avg 39.7% · 1 of 8
- Paint share of points
- 27.9%
- avg 31.8% · 6 of 8
- Free-throw rate
- 0.30
- avg 0.30 · 3 of 8
- Turnover rate
- 10.9%
- avg 11.9% · 4 of 8
- Offensive rebounding
- 28.1%
- avg 28.7% · 6 of 8
- Bench share of points
- 26.4%
- avg 16.2% · 1 of 8
- Assist rate
- 67.4%
- avg 57.8% · 2 of 8
Bars show how far each figure is from the tournament average, turned so that right is better.
Quarter profile
- Best quarter
- Q1 +0.7
- Worst quarter
- Q3 -6.0
- Biggest run for
- 9-0 v KUW (Q1)
- Biggest run against
- 11-0 v KUW (Q1)
- Lead changes per game
- 2.3
Lineups and rotation
Best lineup · 15+ minutes




- Min
- 23.7
- Poss
- 47.1
- ORtg
- 127.4
- DRtg
- 121.0
Bench vs starters
- Starters as a unit
- 19.0% of minutes · net -9.7 · 15.2 min
- Bench-heavy lineups (3+ bench players)
- 13.0% of minutes · net -19.0 · 10.4 min
| Lineup | Min | Poss | ORtg | DRtg | Net | +/- | When used |
|---|---|---|---|---|---|---|---|
Most-used lineup 1
|
23.7 | 47.1 | 127.4 | 121.0 | +6.4 | +3 | 1 2 3 4 |
Most-used lineup 2
|
9.2 | 21.1 | 99.3 | 108.8 | -9.5 | -2 | 1 2 3 4 |
Most-used lineup 3
|
6.7 | 14.8 | 115.2 | 115.2 | 0.0 | 0 | 1 2 3 4 |
Most-used lineup 4
|
6.3 | 11.7 | 94.3 | 85.8 | +8.6 | +1 | 1 2 3 4 |
Most-used lineup 5
|
4.7 | 10.2 | 49.2 | 59.1 | -9.8 | -1 | 1 2 3 4 |
Starting five
· started 1 of 3
|
23.7 | 47.1 | 127.4 | 121.0 | +6.4 | +3 | 1 2 3 4 |
Closing five
· 0.6 of 0.8 min
|
0.6 | 1.7 | 116.3 | 174.4 | -58.1 | -1 | – |
When behind by 5+
· 8.2 of 39.1 min
|
8.2 | 17.3 | 104.3 | 98.5 | +5.8 | +1 | – |
When ahead by 5+
· 9.5 of 18.5 min
|
9.5 | 18.2 | 170.0 | 142.5 | +27.4 | +5 | – |



Per game: over the 2 games with play-by-play.
How the lineups were used, game by game
The lineup with the most minutes in each game and its net rating in that game.
Players to know
-

Top scorer
A. Archibald
24.0 PPG · 3 GP · 93.2 min
-
Top usage
A. Archibald
27.2% usage · 3 GP · 93.2 min
-
Best net on court
A. Archibald
-0.8 net · 3 GP · 93.2 min
-
Best on/off
A. Archibald
+41.5 on/off · 3 GP · 93.2 min
-
Best shooter (TS%)
A. Archibald
69.0% TS · 3 GP · 93.2 min
-

Foul trouble risk
M. Kadi
5.7 fouls per 36 · 3 GP · 50.8 min
-
Turnover risk
A. Archibald
13.3% TOV · 3 GP · 93.2 min
Every pick: a third of the team's games at least. Usage, net, on/off, fouls and turnovers: 40 minutes at least; TS%: 20 shots at least.
Clutch
0-2 in 2 close games (of 3 with play-by-play), -6 points in the clutch.
Clutch ORtg 92.6, DRtg 231.5 over 2.2 possessions.
Goes to M. Kadi in the clutch (1.0 possessions used).