

 Al-Riyadi
 Antonine
 Antranik
 Atlas Ferzol
 Beirut
 Central
 Chabeb El Batroun
 Homenetmen
 Hoops
 NSA
 Sagesse



Record 0-3 · Net rating -10.8 · ORtg 103.0 · DRtg 113.8 · Games with box scores: 3 (2 with play-by-play)
Every line compares this team with the tournament average and ranks it among the 8 teams.
Strengths
| Value | Average | Rank | |
|---|---|---|---|
| Forces turnoversTurnovers forced | 15.6% | 11.9% | 1/8 |
| Moves the ballAssist rate | 67.4% | 57.8% | 2/8 |
| Ends possessions on the glassDefensive rebounding | 74.2% | 71.1% | 2/8 |
Weaknesses
| Value | Average | Rank | |
|---|---|---|---|
| Allows easy shotsOpponents' eFG% | 56.0% | 50.5% | 8/8 |
| Opponents hit their threesOpponents' 3P% | 35.5% | 31.1% | 8/8 |
| Fouls a lotOpponents' free-throw rate | 0.39 | 0.30 | 7/8 |
| Shoots poorlyEffective FG% | 46.7% | 49.7% | 7/8 |
| Leaks pointsDefensive rating | 113.8 | 109.1 | 7/8 |
Four factors against the average
Bars show how far each figure is from the tournament average, turned so that right is better.
Quarter profile
| Q1 | Q2 | Q3 | Q4 | |
|---|---|---|---|---|
| For | 24.0 | 22.3 | 21.0 | 18.7 |
| Against | 23.3 | 24.0 | 27.0 | 20.7 |
| Margin | +0.7 | -1.7 | -6.0 | -2.0 |
Identity
| Value | Average | Rank | |
|---|---|---|---|
| Pace | 83.5 | 81.5 | 2/8 |
| Offensive rating | 103.0 | 107.3 | 7/8 |
| Defensive rating | 113.8 | 109.1 | 7/8 |
| Three-point rate | 47.8% | 39.7% | 1/8 |
| Paint share of points | 27.9% | 31.8% | 6/8 |
| Value | Average | Rank | |
|---|---|---|---|
| Free-throw rate | 0.30 | 0.30 | 3/8 |
| Turnover rate | 10.9% | 11.9% | 4/8 |
| Offensive rebounding | 28.1% | 28.7% | 6/8 |
| Bench share of points | 26.4% | 16.2% | 1/8 |
| Assist rate | 67.4% | 57.8% | 2/8 |
Ittihad Club · Lineups and rotation
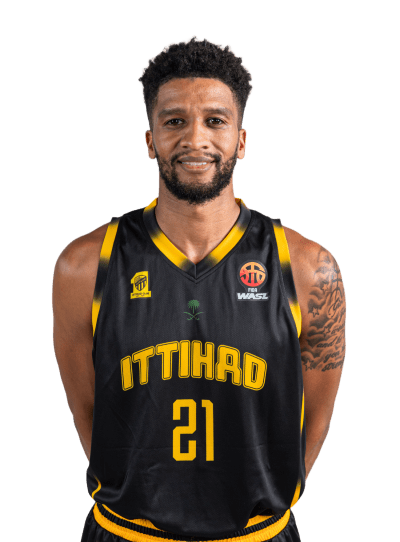 K. Abdel Gabar
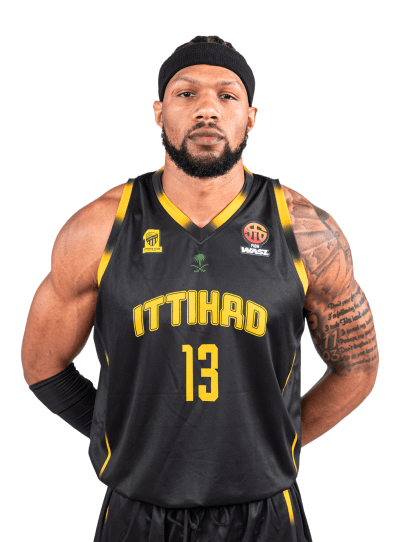 M. Clark
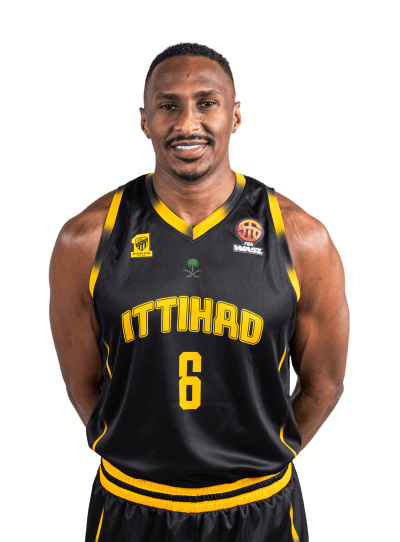 M. Almarwani
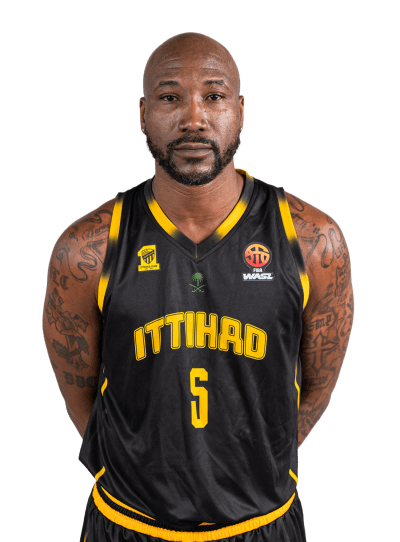 D. Chism
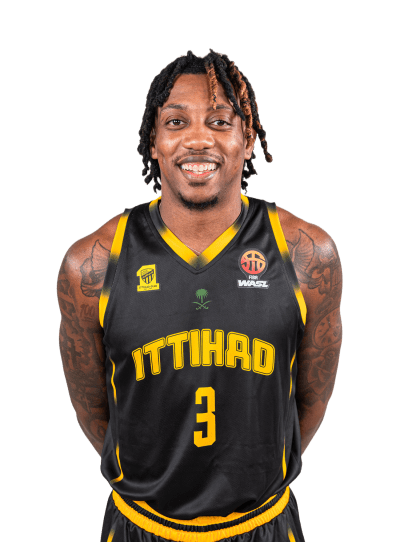 A. Anthony Archibald
- Min
- 23.7
- Poss
- 47.1
- ORtg
- 127.4
- DRtg
- 121.0
- Net
- +6.4
- +/-
- +3
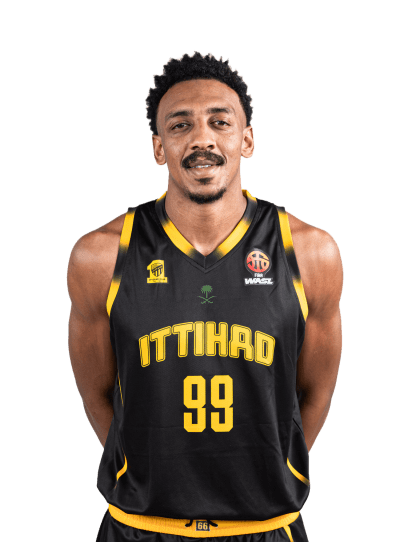 M. Tariq M Kadi
- K. Abdel Gabar
- M. Clark
- M. Almarwani
- D. Chism
- Min
- 9.2
- Poss
- 21.1
- ORtg
- 99.3
- DRtg
- 108.8
- Net
- -9.5
- +/-
- -2
- M. Tariq M Kadi
- K. Abdel Gabar
- M. Clark
- D. Chism
- A. Anthony Archibald
- Min
- 6.7
- Poss
- 14.8
- ORtg
- 115.2
- DRtg
- 115.2
- Net
- 0.0
- +/-
- 0
- K. Abdel Gabar
- M. Clark
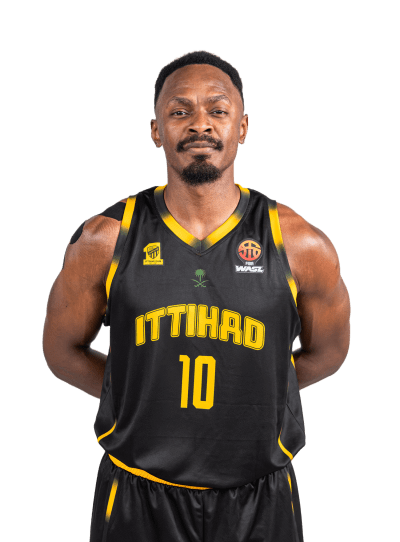 N. Alabsi
- M. Almarwani
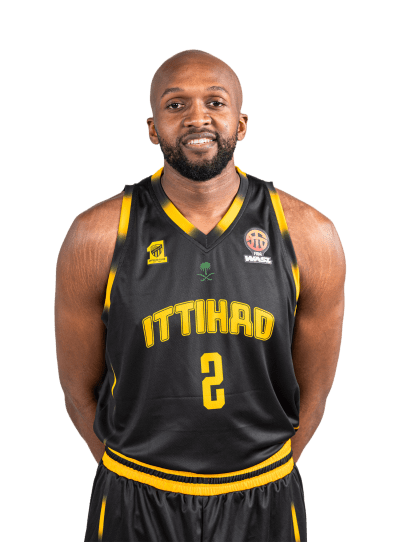 T. Mahmoud A Mohammed
- Min
- 6.3
- Poss
- 11.7
- ORtg
- 94.3
- DRtg
- 85.8
- Net
- +8.6
- +/-
- +1
 M. Alsalem
- K. Abdel Gabar
- M. Almarwani
- D. Chism
- A. Anthony Archibald
- Min
- 4.7
- Poss
- 10.2
- ORtg
- 49.2
- DRtg
- 59.1
- Net
- -9.8
- +/-
- -1
- K. Abdel Gabar
- M. Clark
- M. Almarwani
- D. Chism
- A. Anthony Archibald
- Min
- 23.7
- Poss
- 47.1
- ORtg
- 127.4
- DRtg
- 121.0
- Net
- +6.4
- +/-
- +3
- M. Tariq M Kadi
- K. Abdel Gabar
- M. Clark
- M. Almarwani
- A. Anthony Archibald
- Min
- 0.6
- Poss
- 1.7
- ORtg
- 116.3
- DRtg
- 174.4
- Net
- -58.1
- +/-
- -1
- M. Tariq M Kadi
- K. Abdel Gabar
- M. Clark
- M. Almarwani
- D. Chism
- Min
- 8.2
- Poss
- 17.3
- ORtg
- 104.3
- DRtg
- 98.5
- Net
- +5.8
- +/-
- +1
- K. Abdel Gabar
- M. Clark
- M. Almarwani
- D. Chism
- A. Anthony Archibald
- Min
- 9.5
- Poss
- 18.2
- ORtg
- 170.0
- DRtg
- 142.5
- Net
- +27.4
- +/-
- +5
The five with the most minutes in the last 5 minutes of the fourth quarter and overtime with the score within 5. The five used most while the team was behind by 5 or more. The five used most while the team was ahead by 5 or more.
Rotation · 7 players over 10 minutes a game
Lineup net rating
Starters as a unit: 19.0% of minutes · net -9.7 · 15.2 min
Bench-heavy lineups (3+ bench players): 13.0% of minutes · net -19.0 · 10.4 min
Players to know
Every pick: a third of the team's games at least. Usage, net, on/off, fouls and turnovers: 40 minutes at least; TS%: 20 shots at least. Games within 5 points in the last 5 minutes.
Source: FIBA WASL. All data and images courtesy of FIBA WASL. · cedarsmetrics.com