

 Al-Riyadi
 Antonine
 Antranik
 Atlas Ferzol
 Beirut
 Central
 Chabeb El Batroun
 Homenetmen
 Hoops
 NSA
 Sagesse
 WASL Final 8
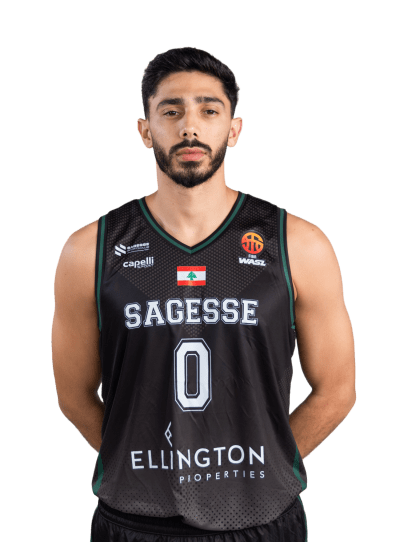

PPG
5.0
RPG
1.0
APG
0.7
EFF
5.0
FG%
71.4%
3P%
71.4%
FT%
0%
MPG
10:23
Per game over 3 games played; percentages over all the attempts.
FIBA WASL Final 8 2026 averages
GP
3
PPG
5
RPG
1
APG
0.7
SPG
0.3
BPG
0
FG%
71.4
3P%
71.4
FT%
0
MPG
10.4
EFF
5
TOV
1
Highs in this tournament
Scoring trend
Game by game
Shooting
- FG
- 5/7 71.4%
- 2PT
- 0/0 –
- 3PT
- 5/7 71.4%
- FT
- 0/1 0%
Scoring breakdown
Game-by-game efficiency
Detailed statistics 3 games
Scoring
- PPG
- 5
- Total points
- 15
- Games started
- 1/3
- MPG
- 10.4
Shooting
- FG
- 71.4% · 2.3 att./g
- 3PT
- 71.4% · 2.3 att./g
- 2PT%
- –
- FT
- 0% · 0.3 att./g
- Total FGM
- 5-7
Rebounds & assists
- RPG
- 1
- Offensive
- 0.3
- Defensive
- 0.7
- Total rebounds
- 3
- APG
- 0.7
- Total assists
- 2
Defense & other
- SPG
- 0.3
- BPG
- 0
- TOV
- 1
- Fouls
- 2
- Efficiency
- 5
- +/-
- -1
- Total steals
- 1
- Total blocks
- 0
FG% per game
| Game | Result | MIN | PTS | REB | AST | ||||||||||
|---|---|---|---|---|---|---|---|---|---|---|---|---|---|---|---|
4 Oct @
 RIY
L 67-75 · FG 2-2 · 3PT 2-2 · FT 0-0 · OR 0 · DR 2 · STL 0 · BLK 0 · TO 1 · PF 2 · EFF 8 |
L67-75 | 12:34 | 6 | 2 | 1 | ||||||||||
3 Oct vs
 KUW
W 87-74 |
W87-74 | Did not play | |||||||||||||
1 Oct @
 ARB
W 90-85 · FG 2-3 · 3PT 2-3 · FT 0-1 · OR 0 · DR 0 · STL 0 · BLK 0 · TO 2 · PF 3 · EFF 3 |
W90-85 | 11:58 | 6 | 0 | 1 | ||||||||||
29 Sep vs
 ULA
W 95-89 · FG 1-2 · 3PT 1-2 · FT 0-0 · OR 1 · DR 0 · STL 1 · BLK 0 · TO 0 · PF 1 · EFF 4 |
W95-89 | 6:37 | 3 | 1 | 0 | ||||||||||
27 Sep @
 GOR
W 103-97 |
W103-97 | Did not play | |||||||||||||
| Totals FG 5-7 · 71.4% · 3PT 5-7 · 71.4% · FT 0-1 · 0.0% · OR 1 · DR 2 · STL 1 · BLK 0 · TO 3 · PF 6 · EFF 15 | 31:09 | 15 | 3 | 2 | |||||||||||
| Averages FG 71.4% · 2.3 att./g · 3PT 71.4% · 2.3 att./g · FT 0.0% · 0.3 att./g · OR 0.3 · DR 0.7 · STL 0.3 · BLK 0.0 · TO 1.0 · PF 2.0 · EFF 5.0 | 10:23 | 5.0 | 1.0 | 0.7 | |||||||||||
Shooting efficiency
- True shooting % PTS ÷ (2 × (FGA + 0.44 × FTA))
- 100.8%
- Effective FG% (FGM + 0.5 × 3PM) ÷ FGA: a three counts 1.5 times a two
- 107.1%
- FG%
- 71.4%
- 3PT%
- 71.4%
- FT%
- 0%
- Points per FGA Total points ÷ field-goal attempts
- 2.14
Shot profile & ratios
- 3PA rate Three-point attempts as a share of all field-goal attempts
- 100%
- Free throw rate Free-throw attempts per field-goal attempt
- 14.3%
- AST/TO ratio
- 0.67
- Efficiency (EFF)
- 5
- Plus/minus (avg)
- -1
- Minutes / game
- 10.4
Per 36 minutes normalised to 36 minutes for a fair comparison between players
| PTS | REB | AST | |
|---|---|---|---|
| Per gameSTL 0.3 · BLK 0 · TOV 1 | 5 | 1 | 0.7 |
| Per 36 minutesSTL 1.2 · BLK 0 · TOV 3.5 | 17.3 | 3.5 | 2.3 |
Tournament totals
| PTS | REB | AST | |
|---|---|---|---|
| 3 gamesSTL 1 · BLK 0 · TOV 3 · FGM 5 · FGA 7 · 3PM 5 · 3PA 7 · FTM 0 · FTA 1 | 15 | 3 | 2 |
Usage, rebounding & impact
USG%
15.7%
ORB%
3.4%
DRB%
6.8%
TRB%
5.1%
GmSc
3.3
GmSc best
4.9
+/- per game
-1
PPS
2.14
Shares use the 3 games with minutes recorded.
Splits
| PPG | TS% | +/- | |
|---|---|---|---|
| HomeGP 1 · RPG 1 · APG 0 · FG% 50% | 3 | 75% | +3 |
| AwayGP 2 · RPG 1 · APG 1 · FG% 80% | 6 | 110.3% | -3 |
| WinsGP 2 · RPG 0.5 · APG 0.5 · FG% 60% | 4.5 | 82.7% | +0.5 |
| LossesGP 1 · RPG 2 · APG 1 · FG% 100% | 6 | 150% | -4 |
Clutch
Points
0
0 a game
FG
0/0
–
FT
0/0
TS%
–
Clutch plays in 1 of 3 games with play-by-play, matched by shirt number.
Streaks
- 10+ points in a row0 now · best 0
- 20+ points in a row0 now · best 0
- Double-doubles in a row0 now · best 0
Tournament highs
Advanced
| PTS | REB | AST | STL | BLK | TOV | |
|---|---|---|---|---|---|---|
| Per game | 5.0 | 1.0 | 0.7 | 0.3 | 0.0 | 1.0 |
| Per 36 min | 17.3 | 3.5 | 2.3 | 1.2 | 0.0 | 3.5 |
Rates
- USG%
- 15.7%
- TS%
- 100.8%
- eFG%
- 107.1%
- 3PAr
- 1.000
- FTr
- 0.143
- AST%
- 10.7%
- TOV%
- 28.7%
- ORB%
- 3.4%
- DRB%
- 6.8%
- TRB%
- 5.1%
- STL%
- 1.7%
- BLK%
- 0.0%
Impact
- ORtg
- 129.2
- DRtg
- 134.6
- NRtg
- -5.4
- On/off
- -8.9
- +/- per game
- -1.0
- PIE
- 2.7%
- Game Score
- 3.3
Best game · 4.9
6 pts, 2 reb, 1 ast v RIYShot profile
- 2PT
- 0 of 0
- 3PT
- 5 of 7
- FT
- 0 of 1
- Share of team shots on court
- 13.5%
Clutch
- PTS
- 0
- FG
- 0-0
- 3PT
- 0-0
- FT
- 0-0
- REB
- 0
- AST
- 0
- TOV
- 0
- Games with a clutch stretch
- 1
By game
| Date | Opponent | NRtg |
|---|---|---|
| 29 Sep | ULA W MIN 6.6 · USG% 13.6% · TS% 75.0% · ORtg 158.4 · DRtg 128.7 · +/- +3 · Game Score 3.3 | +29.7 |
| 1 Oct | @ ARB W MIN 12.0 · USG% 22.1% · TS% 87.2% · ORtg 132.0 · DRtg 140.8 · +/- -2 · Game Score 1.8 | -8.8 |
| 4 Oct | @ RIY L MIN 12.6 · USG% 11.3% · TS% 150.0% · ORtg 113.4 · DRtg 130.9 · +/- -4 · Game Score 4.9 | -17.5 |
Shot chart 7 field-goal attempts
- At the rim 0/0
- Short range 0/0
- Mid-range 0/0
- Three-point 5/7
- Darker = better percentage. Zones come from the shot type in FIBA's play-by-play (it has no court positions).
Shooting
By shot type
- Jump shot 4/6 · 67%
- Step-back jump shot 1/1 · 100%
Shooting by opponent
| Opponent | FGA | FGM | FG% | 2PA | 2PM | 2P% | 3PA | 3PM | 3P% |
|---|---|---|---|---|---|---|---|---|---|
|
ARB
FG 2/3 · 2P 0/0 · 3P 2/3 |
3 | 2 | 66.7% | 0 | 0 | 0% | 3 | 2 | 66.7% |
|
ULA
FG 1/2 · 2P 0/0 · 3P 1/2 |
2 | 1 | 50% | 0 | 0 | 0% | 2 | 1 | 50% |
|
RIY
FG 2/2 · 2P 0/0 · 3P 2/2 |
2 | 2 | 100% | 0 | 0 | 0% | 2 | 2 | 100% |
| TotalFG 5/7 · 2P 0/0 · 3P 5/7 | 7 | 5 | 71.4% | 0 | 0 | 0% | 7 | 5 | 71.4% |